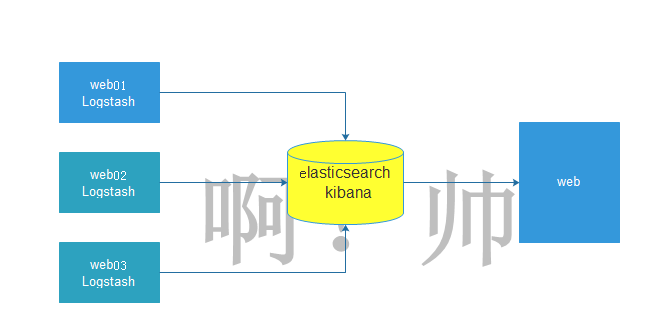
1.ELK简介
ELK是三个开源软件的缩写,分别表示:Elasticsearch , Logstash, Kibana , 它们都是开源软件。新增了一个FileBeat,它是一个轻量级的日志收集处理工具(Agent),Filebeat占用资源少,适合于在各个服务器上搜集日志后传输给Logstash,官方也推荐此工具。
Elasticsearch是个开源分布式搜索引擎,提供搜集、分析、存储数据三大功能。它的特点有:分布式,零配置,自动发现,索引自动分片,索引副本机制,restful风格接口,多数据源,自动搜索负载等。
Logstash 主要是用来日志的搜集、分析、过滤日志的工具,支持大量的数据获取方式。一般工作方式为c/s架构,client端安装在需要收集日志的主机上,server端负责将收到的各节点日志进行过滤、修改等操作在一并发往elasticsearch上去。
Kibana 也是一个开源和免费的工具,Kibana可以为 Logstash 和 ElasticSearch 提供的日志分析友好的 Web 界面,可以帮助汇总、分析和搜索重要数据日志。
Filebeat隶属于Beats。目前Beats包含四种工具:
2.Topbeat(搜集系统、进程和文件系统级别的 CPU 和内存使用情况等数据)
3.Filebeat(搜集文件数据)
4.Winlogbeat(搜集 Windows 事件日志数据)
3.环境准备
| 名称 | IP |
|---|---|
| es01 | 10.0.0.267 |
| es02 | 10.0.0.268 |
| web01 | 10.0.0.269 |
4.搭建elk
4.1关闭防火墙和selinux
systemctl stop firewalld
systemctl disable firewalld
sed -i 's/=enforcing/=disabled/g' /etc/selinux/config
setenforce 0
[root@es01-10.0.0.237 ~]# cd /etc/yum.repos.d/
[root@es01-10.0.0.237 ~]# wget http://mirrors.aliyun.com/repo/Centos-7.repo
[root@es01-10.0.0.237 /elk_soft]# yum install java-1.8.0-openjdk -y
[root@es01-10.0.0.237 ~]# cd /elk_soft/
[root@es01-10.0.0.237 /elk_soft]# ls
elasticsearch-6.4.1.rpm  kibana-6.4.1-x86_64.rpm  logstash-6.4.1.rpm
[root@es01-10.0.0.237 /elk_soft]# yum localinstall elasticsearch-6.4.1.rpm -y

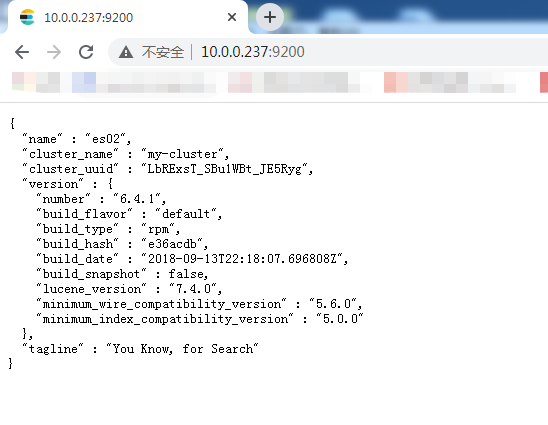
[root@es02-10.0.0.238 /elk_soft]# vim /etc/elasticsearch/elasticsearch.yml
cluster.name: my-cluster        #集群名称
node.name: es02                 #节点名称
path.data: /var/lib/elasticsearch     #存放数据的目录(如果修改将目录的属组属主改为elasticearch)
path.logs: /var/log/elasticsearch     #日志目录(如果修改将目录的属组属主改为elasticearch)
network.host: 10.0.0.238        #本机IP地址
http.port: 9200                 #默认端口
discovery.zen.ping.unicast.hosts: ["10.0.0.237", "10.0.0.238"]       #集群中每个node的IP地址
#在配置文件倒数第二行加入,如果不添加是不能发现别的主机,只能发现自己
http.cors.enabled: true
http.cors.allow-origin: "*"
[root@es01-10.0.0.237 /elk_soft]# systemctl start elasticsearch.service
[root@es01-10.0.0.237 /elk_soft]# systemctl enable elasticsearch.service
[root@es01-10.0.0.237 /elk_soft]# netstat -lntup
Active Internet connections (only servers)
Proto Recv-Q Send-Q Local Address           Foreign Address         State       PID/Program name
tcp        0      0 0.0.0.0:22              0.0.0.0:*               LISTEN      6141/sshd
tcp        0      0 127.0.0.1:25            0.0.0.0:*               LISTEN      6222/master
tcp6       0      0 10.0.0.237:9200         :::*                    LISTEN      8998/java
tcp6       0      0 10.0.0.237:9300         :::*                    LISTEN      8998/java
5.安装head插件来管理集群
5.1在es01上安装head插件,配置epel源
wget http://mirrors.aliyun.com/repo/epel-7.repo
[root@es01-10.0.0.237 ~]# yum install nodejs npm openssl screen -y
[root@es01-10.0.0.237 ~]# node -v
v6.17.1
[root@es01-10.0.0.237 ~]# npm -v
3.10.10
[root@es01-10.0.0.237 ~]# npm install -g cnpm --registry=https://registry.npm.taobao.org
[root@es01-10.0.0.237 ~]# yum install git -y
[root@es01-10.0.0.237 ~]# cd /opt/
[root@es01-10.0.0.237 /opt]# git clone git://github.com/mobz/elasticsearch-head.git
[root@es01-10.0.0.237 /opt]# cd elasticsearch-head/
[root@es01-10.0.0.237 /opt/elasticsearch-head]# ls
crx                elasticsearch-head.sublime-project  index.html    plugin-descriptor.properties  _site
Dockerfile         Gruntfile.js                        LICENCE       proxy                         src
Dockerfile-alpine  grunt_fileSets.js                   package.json  README.textile                test
[root@es01-10.0.0.237 /opt/elasticsearch-head]# cnmp install
[root@es01-10.0.0.237 /opt/elasticsearch-head]# screen -S es-head   #切屏指令
[root@es01-10.0.0.237 /opt/elasticsearch-head]# cnpm run start

> elasticsearch-head@0.0.0 start /opt/elasticsearch-head
> grunt server

Running "connect:server" (connect) task
Waiting forever...
Started connect web server on http://localhost:9100
###Ctrl+A+D  #切换快捷键  后台运行程序
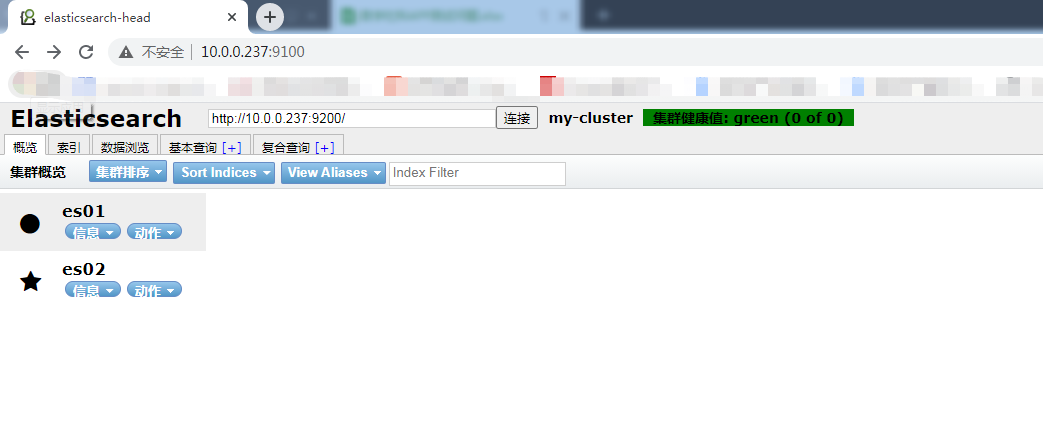
5.7集群的三种健康状态
-
绿色:表示集群健康
-
黄色:表示亚健康状态,勉强可以运行
-
红色:表示已经很危险,有可能数据已经丢失
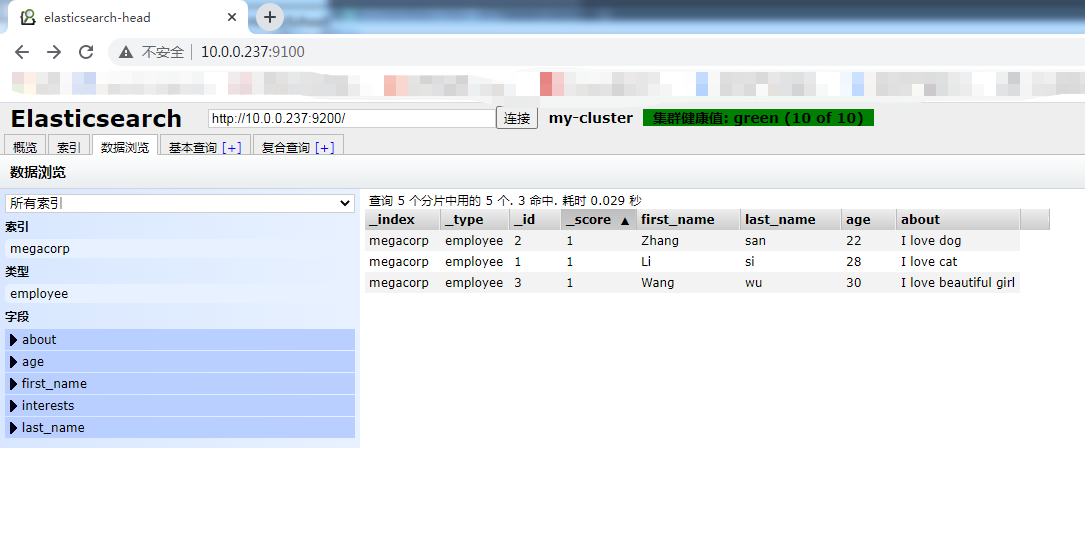
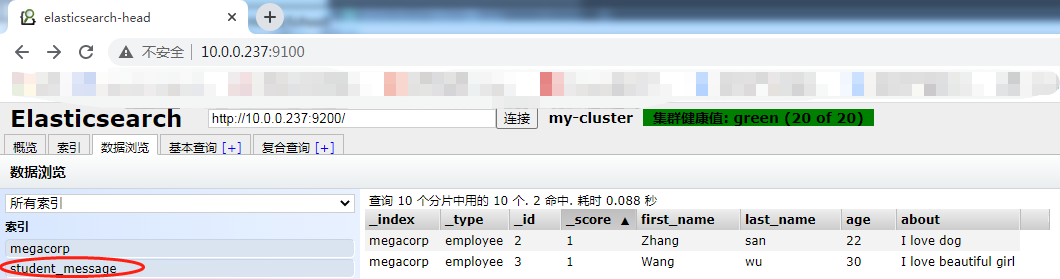
6.elasticearch数据库操作
6.1查入三条数据
curl -XPUT '10.0.0.237:9200/megacorp/employee/1?pretty' -H 'Content-Type: application/json' -d'
    {
        "first_name" : "Li",
        "last_name": "si",
        "age" : 28,
        "about" : "I love cat", "interests": [ "swimming" ]
    }
'
curl -XPUT '10.0.0.237:9200/megacorp/employee/2?pretty' -H 'Content-Type: application/json' -d'
    {
        "first_name" : "Zhang",
        "last_name": "san",
        "age" : 22,
        "about" : "I love dog", "interests": [ "swimming" ]
    }
    '
curl -XPUT '10.0.0.237:9200/megacorp/employee/3?pretty' -H 'Content-Type: application/json' -d'
    {
        "first_name" : "Wang",
        "last_name": "wu",
        "age" : 30,
        "about" : "I love beautiful girl", "interests": [ "swimming" ]
    }
    '
6.3索引介绍
| es数据库 | mysql数据库 |
|---|---|
| index(索引) | database(数据库) |
| type (类型) | tables(数据库中的表) |
| id (id号) | 对应表中的字段 |
6.4如何查询一条数据
[root@es01-10.0.0.237 /opt/elasticsearch-head]# curl -XGET '10.0.0.237:9200/megacorp/employee/1?pretty'
{
  "_index" : "megacorp",
  "_type" : "employee",
  "_id" : "1",
  "_version" : 1,
  "found" : true,
  "_source" : {
    "first_name" : "Li",
    "last_name" : "si",
    "age" : 28,
    "about" : "I love cat",
    "interests" : [
      "swimming"
    ]
  }
}
[root@es01-10.0.0.237 /opt/elasticsearch-head]#  curl -XDELETE '10.0.0.237:9200/megacorp/employee/1?pretty'
{
  "_index" : "megacorp",
  "_type" : "employee",
  "_id" : "1",
  "_version" : 2,
  "result" : "deleted",
  "_shards" : {
    "total" : 2,
    "successful" : 2,
    "failed" : 0
  },
  "_seq_no" : 1,
  "_primary_term" : 1
}
[root@es01-10.0.0.237 /opt/elasticsearch-head]# curl -XPUT '10.0.0.237:9200/student_message?pretty'
{
  "acknowledged" : true,
  "shards_acknowledged" : true,
  "index" : "student_message"
}
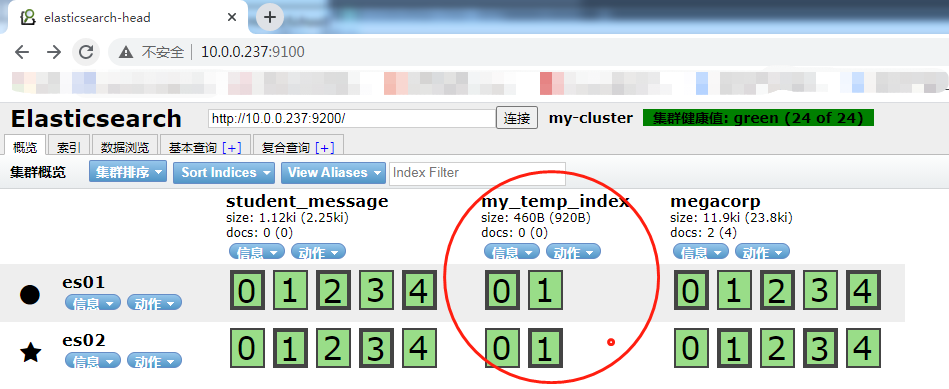
curl -XPUT '10.0.0.237:9200/my_temp_index?pretty' -H 'Content-Type: application/json' -d' {
"settings": {
        "number_of_shards" : 2,
        "number_of_replicas" : 1
    }
}
'
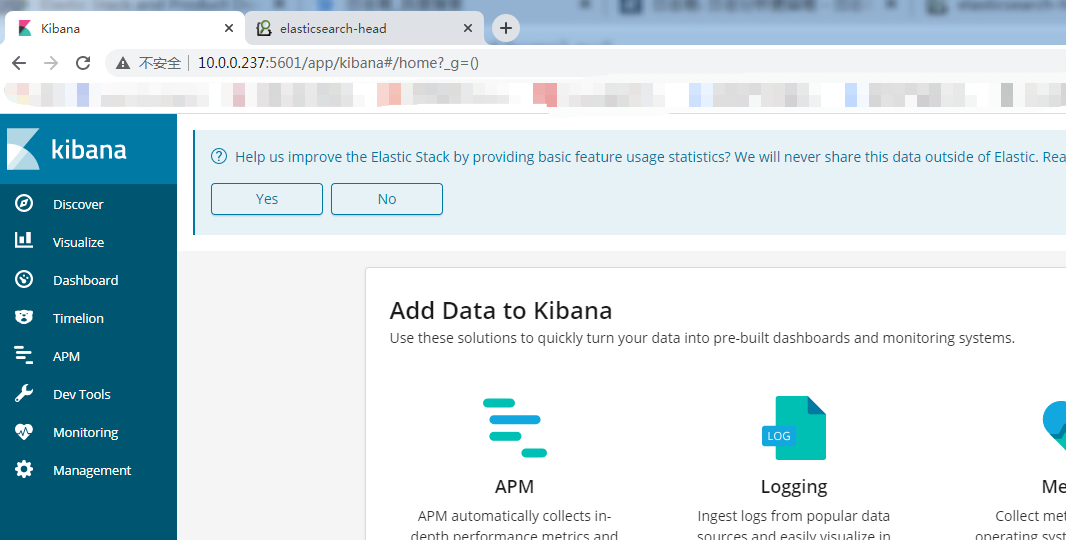
7.kibana安装配置
7.1在es01上安装kibana
[root@es01-10.0.0.237 /elk_soft]# yum localinstall kibana-6.4.1-x86_64.rpm -y
[root@es01-10.0.0.237 /elk_soft]# vim /etc/kibana/kibana.yml
server.port: 5601                    #服务监听端口
server.host: "10.0.0.237"            #服务IP地址
elasticsearch.url: "http://10.0.0.237:9200"         #elasticsearch的地址
elasticsearch.pingTimeout: 30000000
logging.dest: stdout      #如果指定日志存储路径,需要修改文件的所有者及所属组
[root@es01-10.0.0.237 /elk_soft]# systemctl start kibana.service
[root@es01-10.0.0.237 /elk_soft]# systemctl enable kibana.service
[root@es01-10.0.0.237 /elk_soft]# ss -lnt
State      Recv-Q Send-Q             Local Address:Port                            Peer Address:Port
LISTEN     0      128                            *:9100                                       *:*
LISTEN     0      128                            *:22                                         *:*
LISTEN     0      100                    127.0.0.1:25                                         *:*
LISTEN     0      128                   10.0.0.237:5601                                       *:*
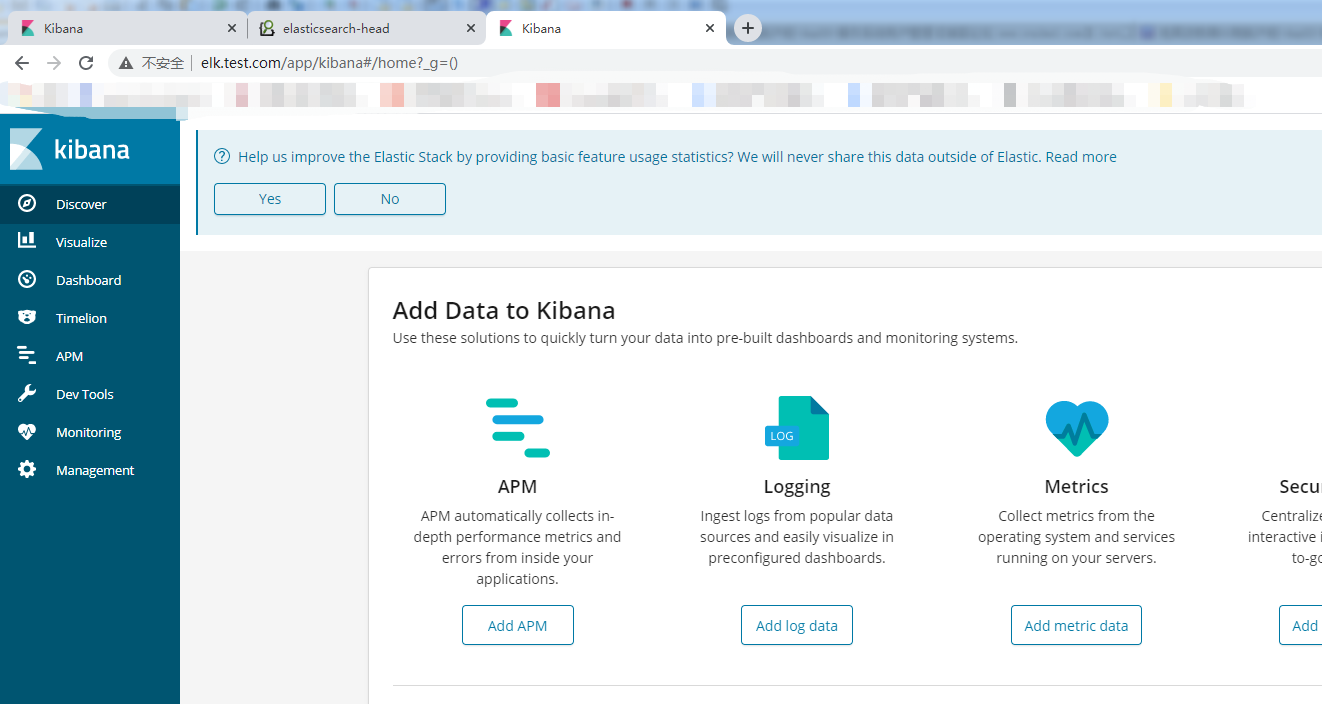
8.在web01上安装nginx+logstash
8.1配置nginx的yum源,安装nginx
[root@web01-10.0.0.239 /etc/yum.repos.d]# vim /etc/yum.repos.d/nginx.repo
[nginx]
name=nginx repo
baseurl=http://nginx.org/packages/centos/7/$basearch/
gpgcheck=0
enabled=1
[root@web01-10.0.0.239 ~]# yum install nginx -y
[root@web01-10.0.0.239 ~]# vim /etc/nginx/conf.d/elk.conf
server {
      listen 80;
      server_name elk.test.com;
      location / {
          proxy_pass      http://10.0.0.237:5601;
          proxy_set_header Host   $host;
          proxy_set_header X-Real-IP      $remote_addr;
          proxy_set_header X-Forwarded-For $proxy_add_x_forwarded_for;
      }
#      access_log  /var/log/nginx/elk_access.log main;
}
[root@web01-10.0.0.239 ~]#  vim /etc/nginx/nginx.conf
log_format access_json '{"@timestamp":"$time_iso8601",'
        '"host":"$server_addr",'
        '"clientip":"$remote_addr",'
        '"size":$body_bytes_sent,'
        '"responsetime":$request_time,'
        '"upstreamtime":"$upstream_response_time",'
        '"upstreamhost":"$upstream_addr",'
        '"http_host":"$host",'
        '"url":"$uri",'
        '"domain":"$host",'
        '"xff":"$http_x_forwarded_for",'
        '"referer":"$http_referer",'
        '"status":"$status"}';
    access_log  /var/log/nginx/   access_json;
[root@web01-10.0.0.239 ~]# systemctl start nginx
[root@web01-10.0.0.239 ~]# systemctl enable nginx
10.0.0.239 elk.tast.com
[root@web01-10.0.0.239 /elk_soft]# yum install java-1.8.0-openjdk -y
[root@web01-10.0.0.239 /elk_soft]# ls
filebeat-6.4.1-x86_64.rpm  logstash-6.4.1.rpm
[root@web01-10.0.0.239 /elk_soft]# vim /etc/logstash/logstash.yml
path.data: /var/lib/logstash  #数据存放目录(如需修改记得修改属主属组)
http.host: "10.0.0.239"      #http的IP地址
http.port: 9600              #监听端口
path.logs: /var/log/logstash   #日志存放目录(如需修改记得修改属主属组)
[root@web01-10.0.0.239 ~]# vim /etc/logstash/conf.d/nginx_access.conf
input {
  file {
    path => "/var/log/nginx/access_json.log"
    start_position => "end"
    type => "nginx_access"
    codec => json
  }
}

output {
    elasticsearch {
      hosts => ["10.0.0.237:9200"]
      index => "nginx_access-%{+YYYY.MM.dd}"
   }
}
[root@web01-10.0.0.239 /etc/logstash]# sudo /usr/share/logstash/bin/system-install /etc/logstash/startup.options systemd
Using provided startup.options file: /etc/logstash/startup.options
Manually creating startup for specified platform: systemd
Successfully created system startup script for Logstash
[root@web01-10.0.0.239 /etc/logstash]# systemctl start logstash
[root@web01-10.0.0.239 /etc/logstash]# systemctl enable logstash
[root@es01-10.0.0.237 /elk_soft]# systemctl restart elasticsearch.service
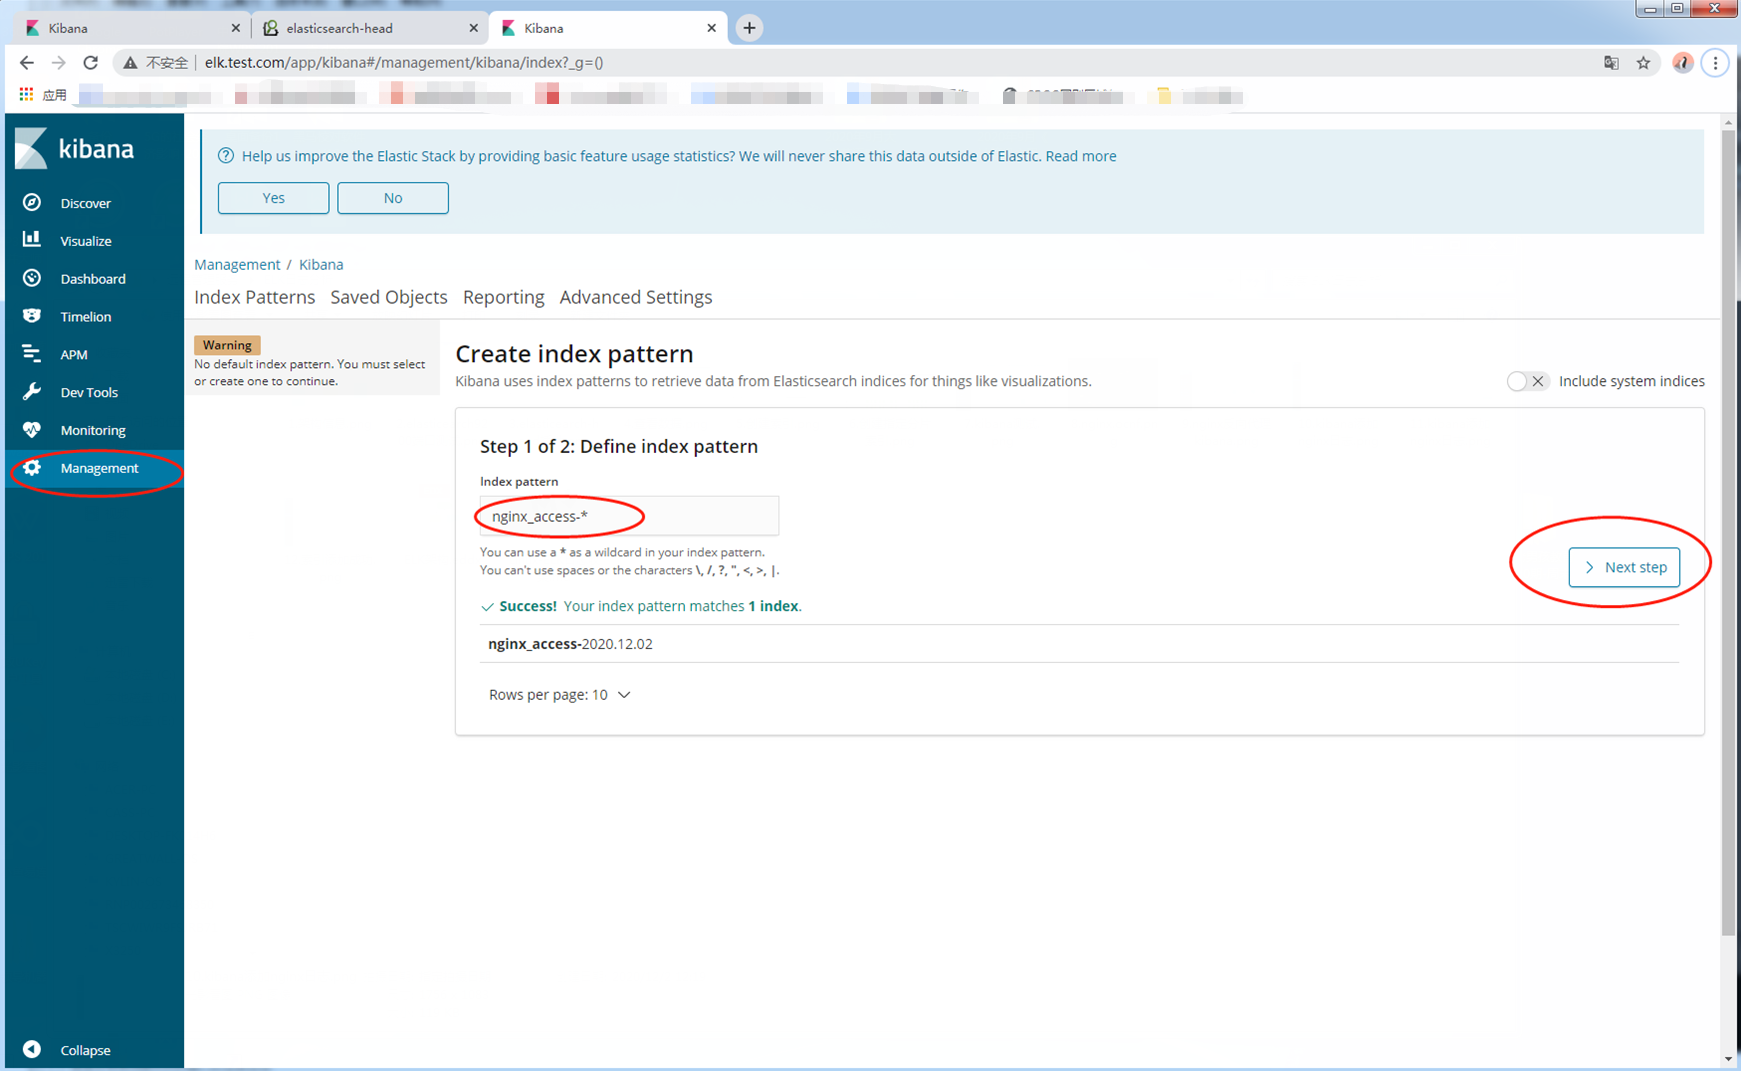
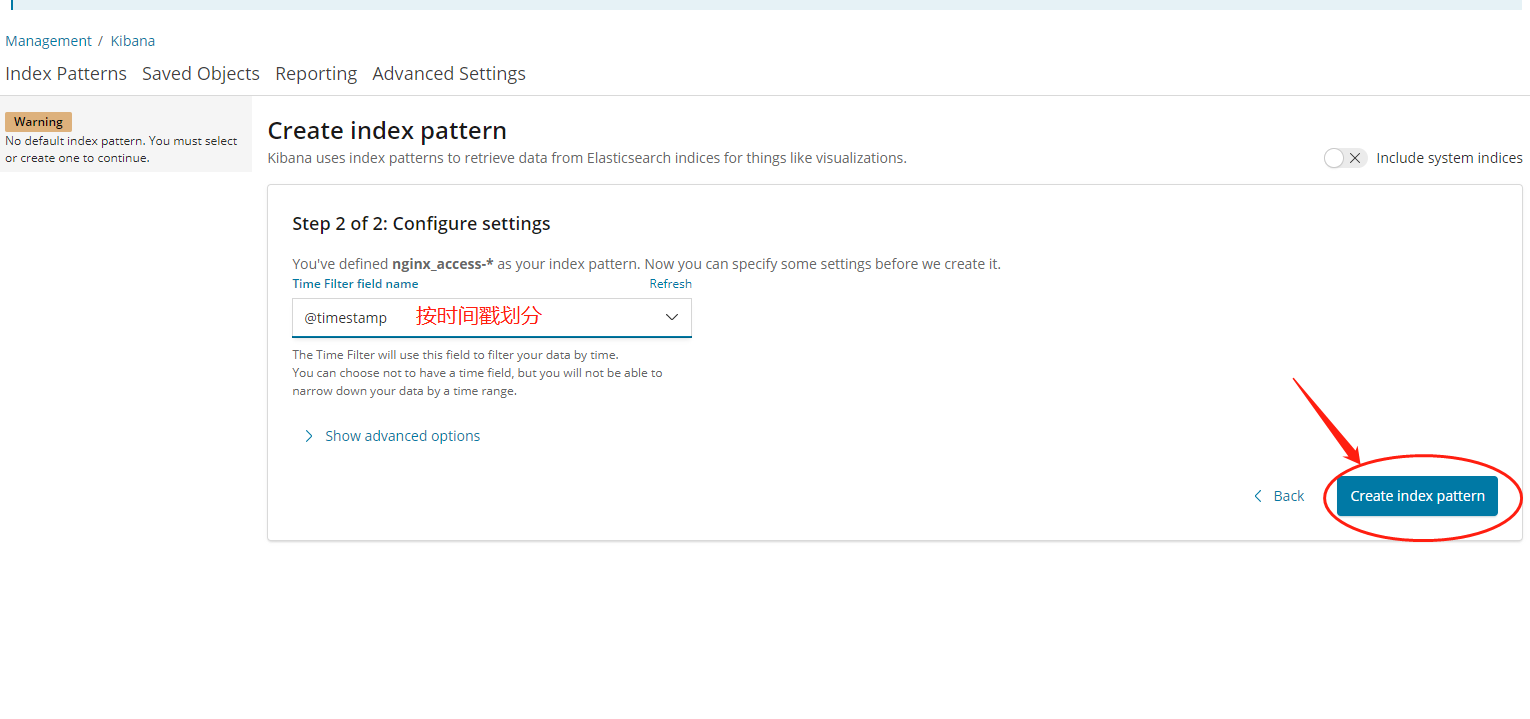
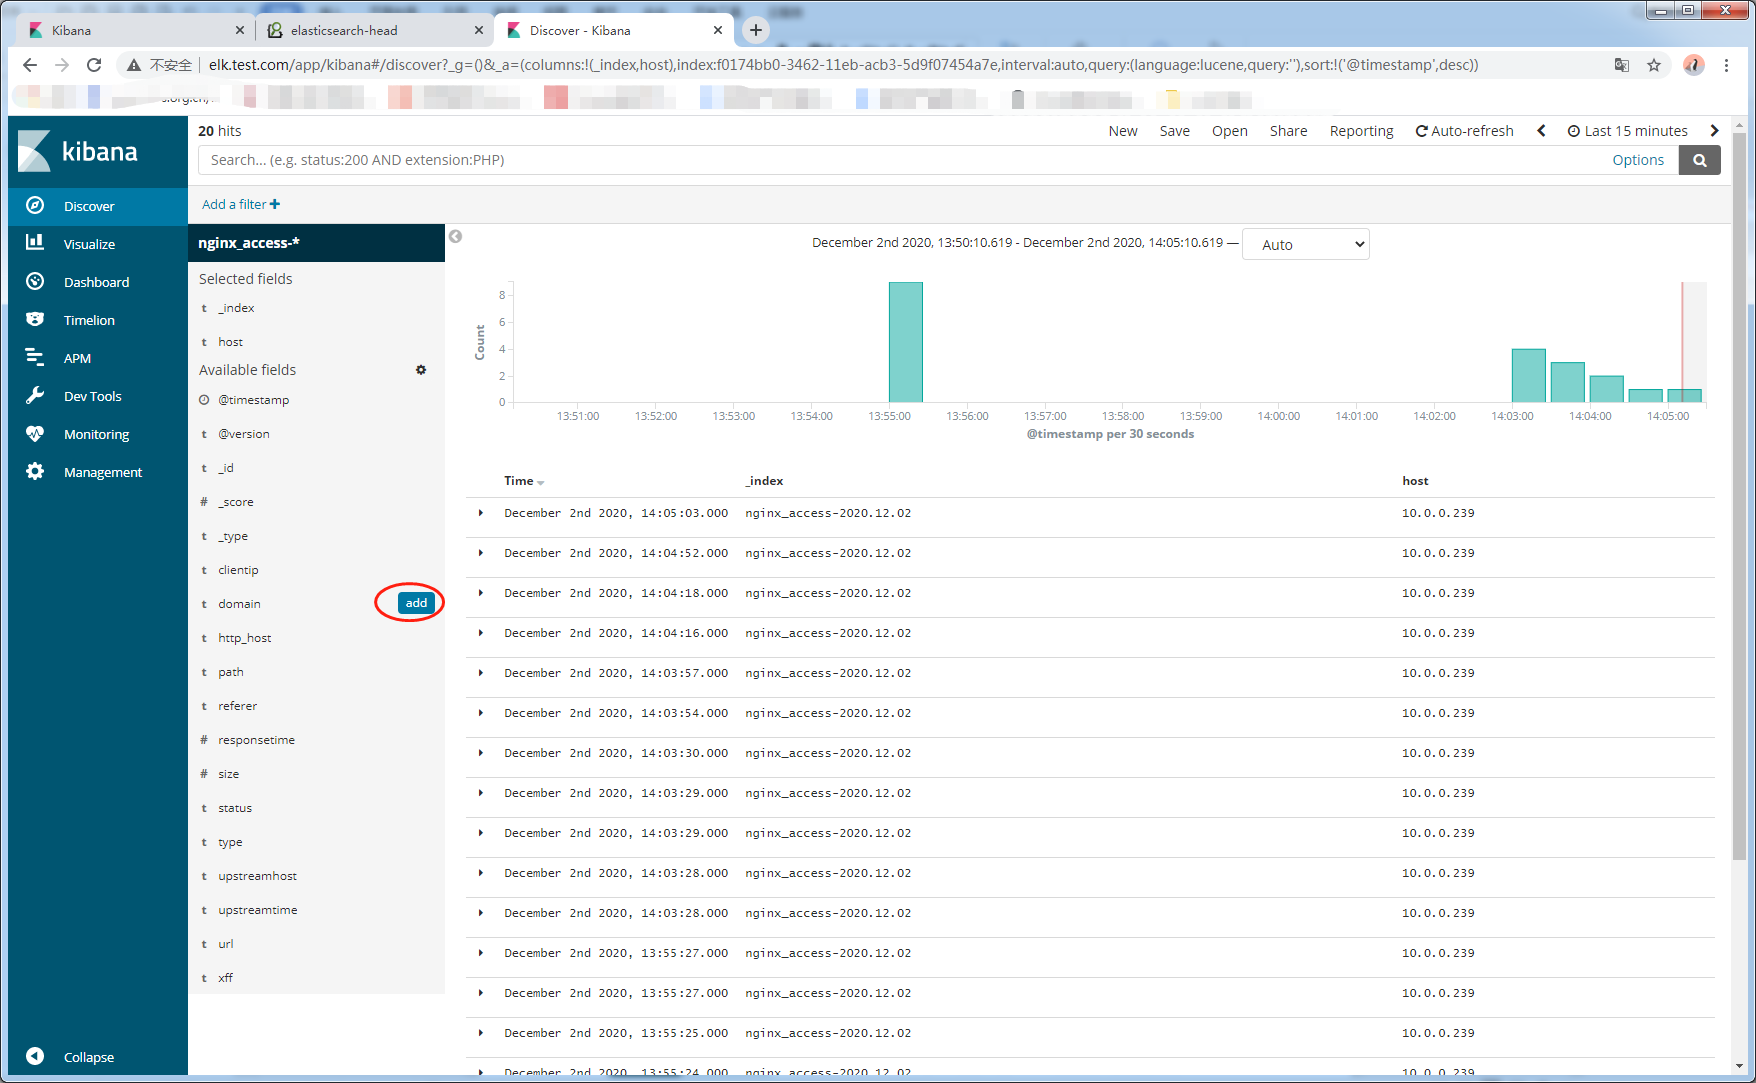
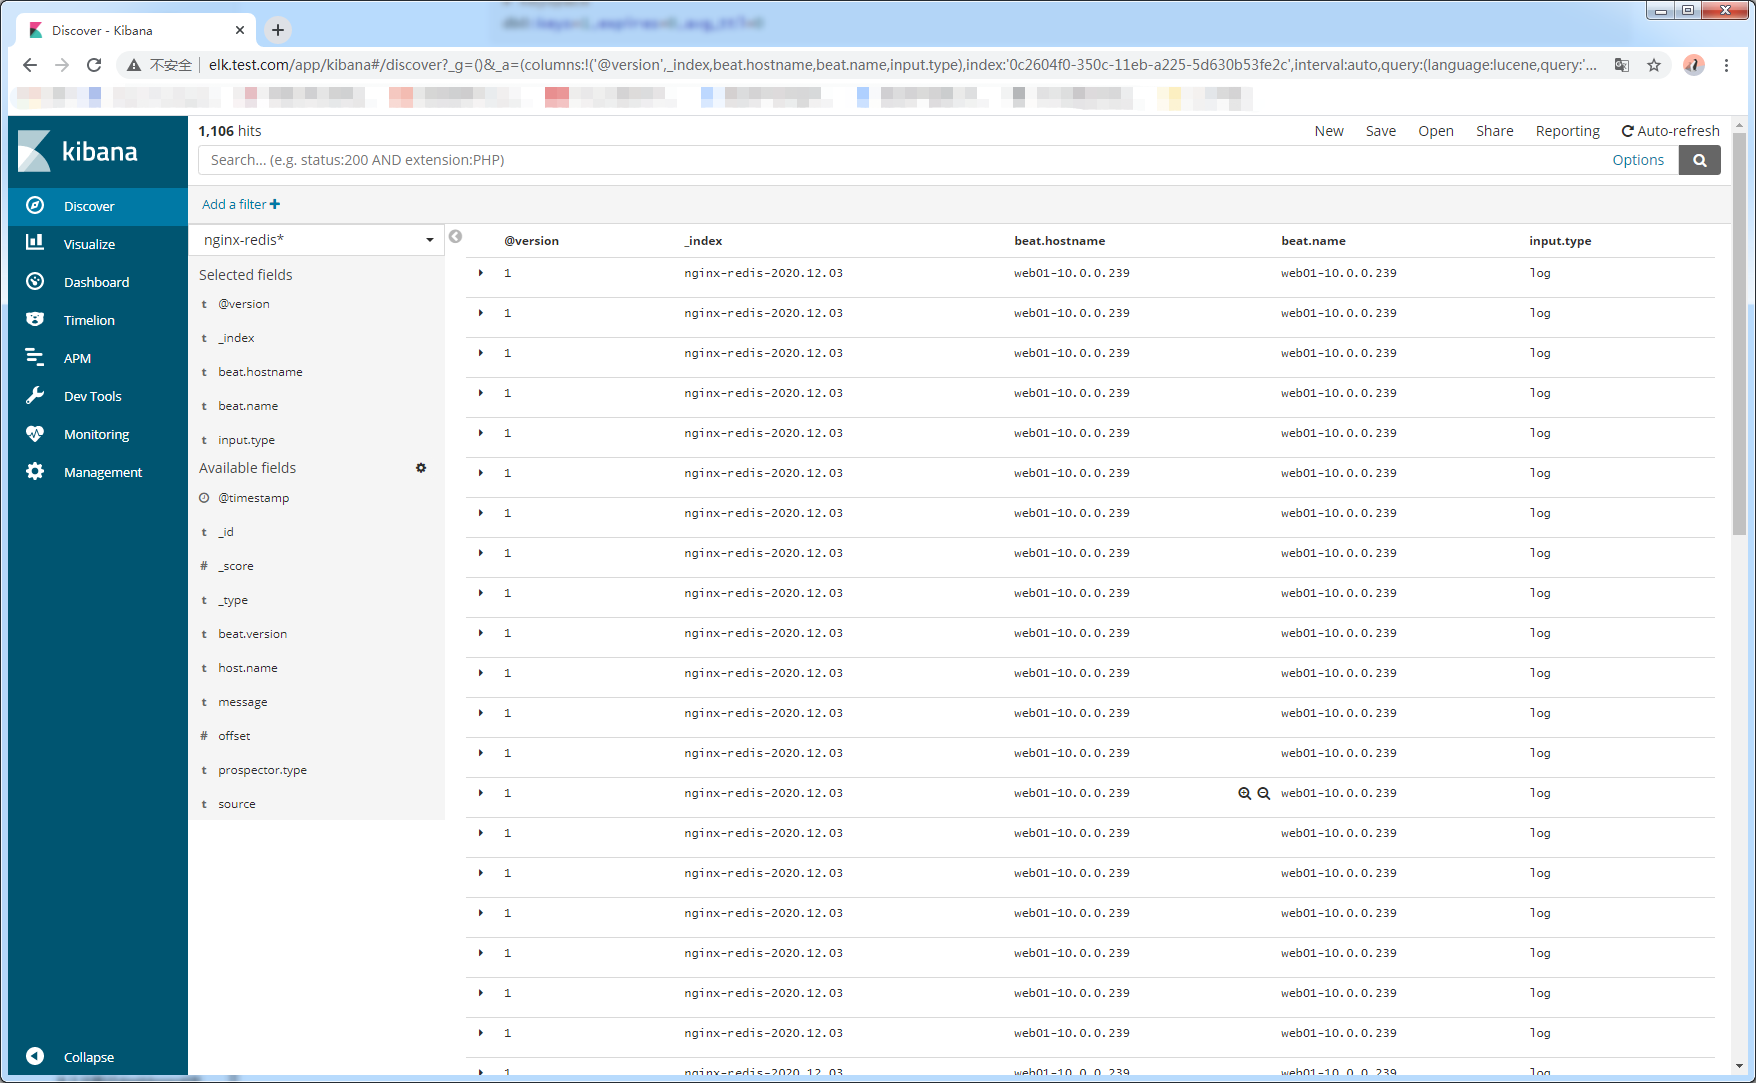
9.2.kibana平台展示所收到的日志信息
9.2.1首先添加一个索引模式
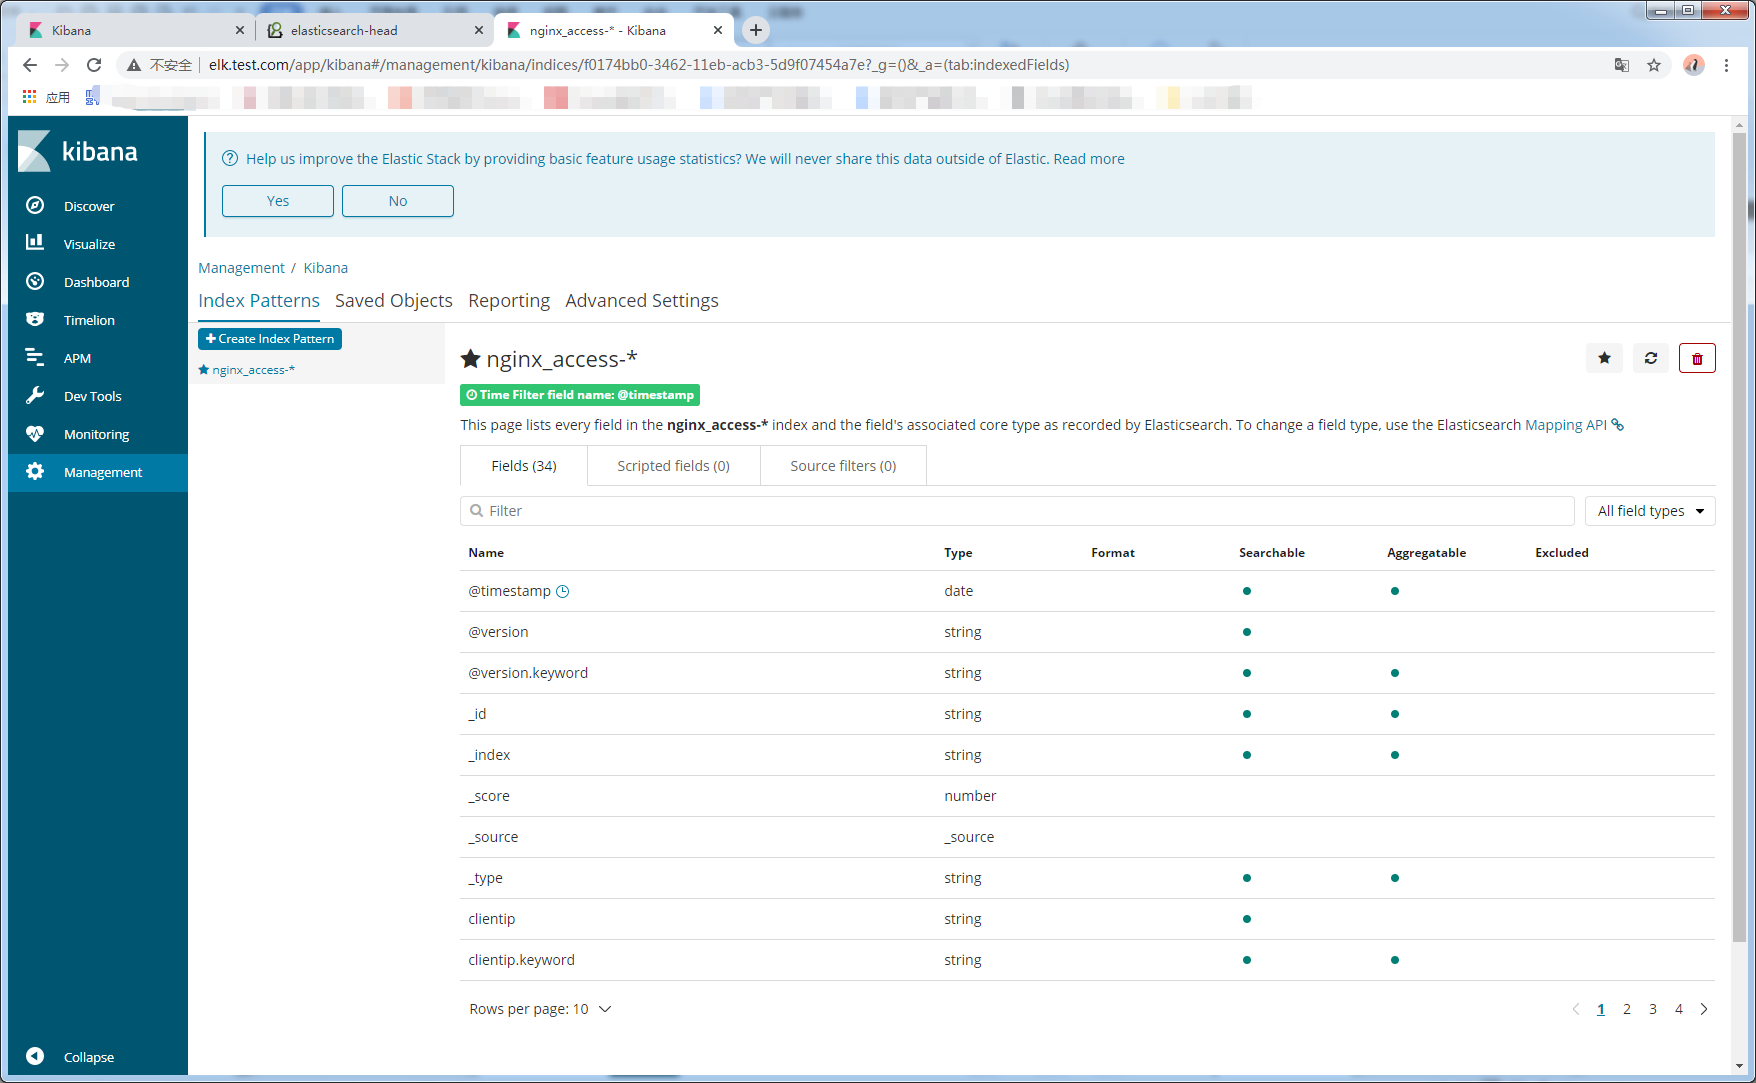
9.2.2添加成功
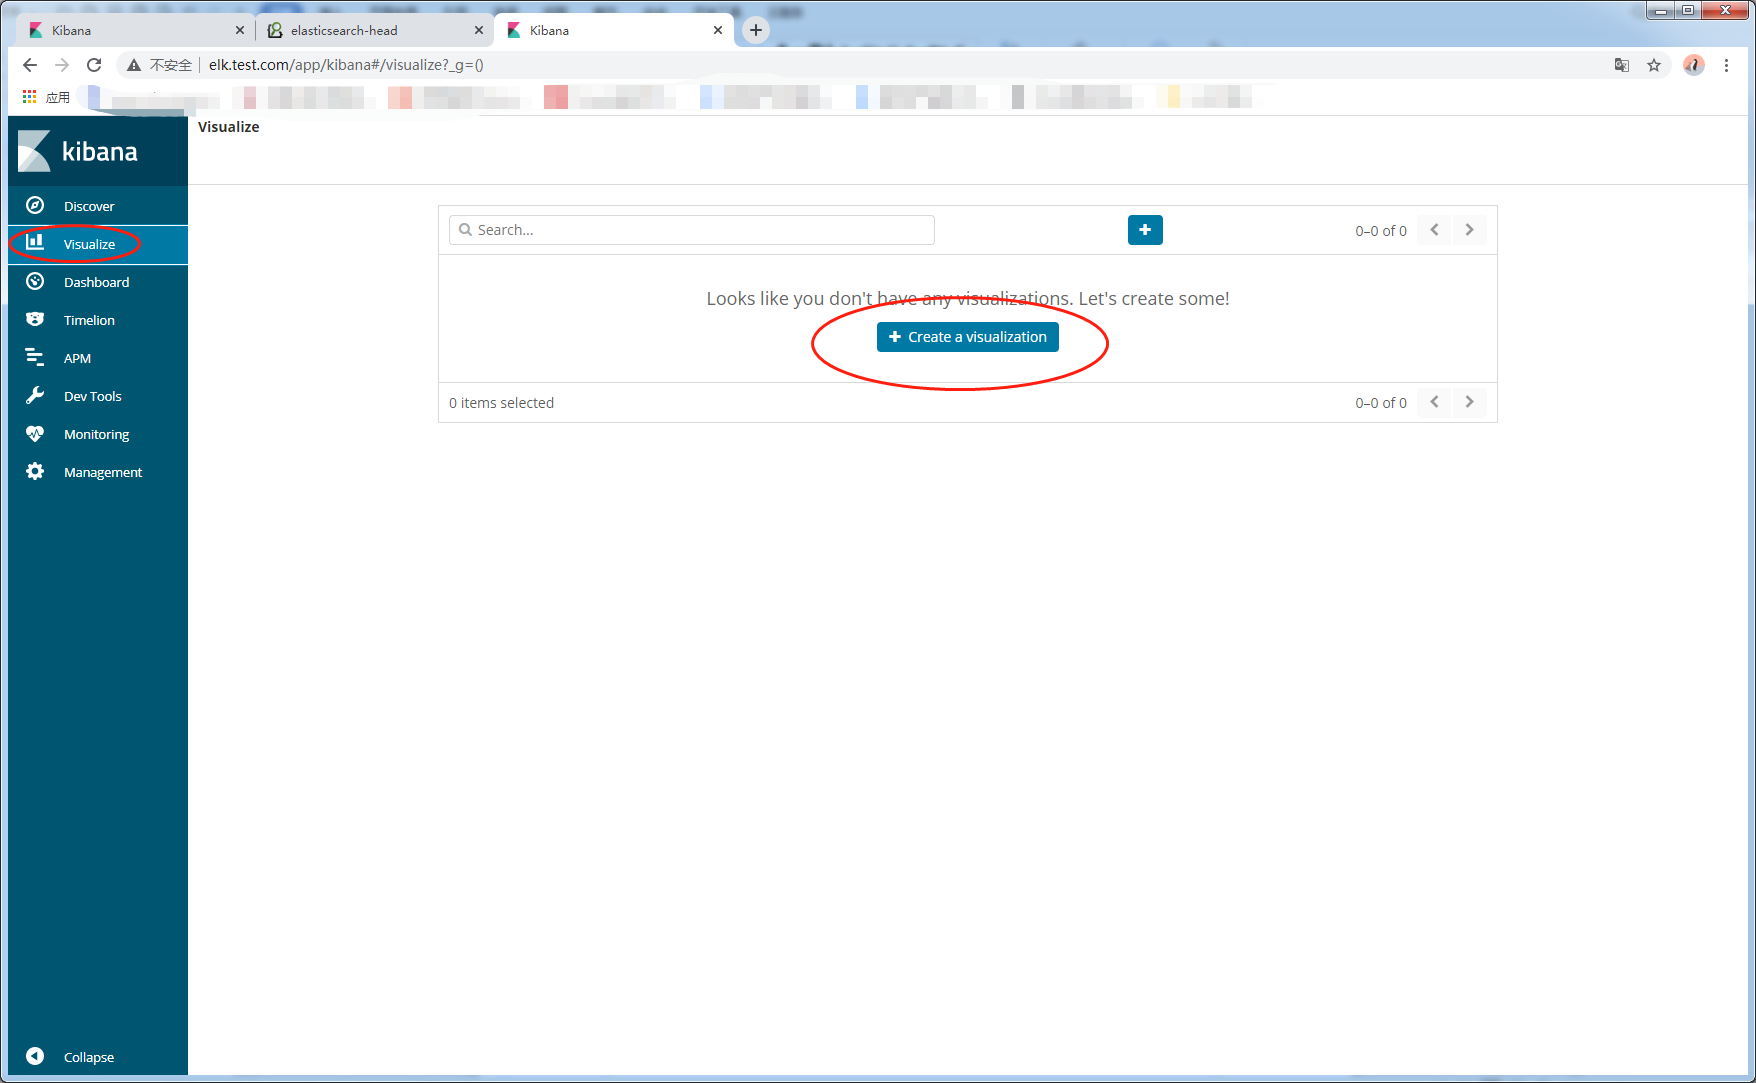
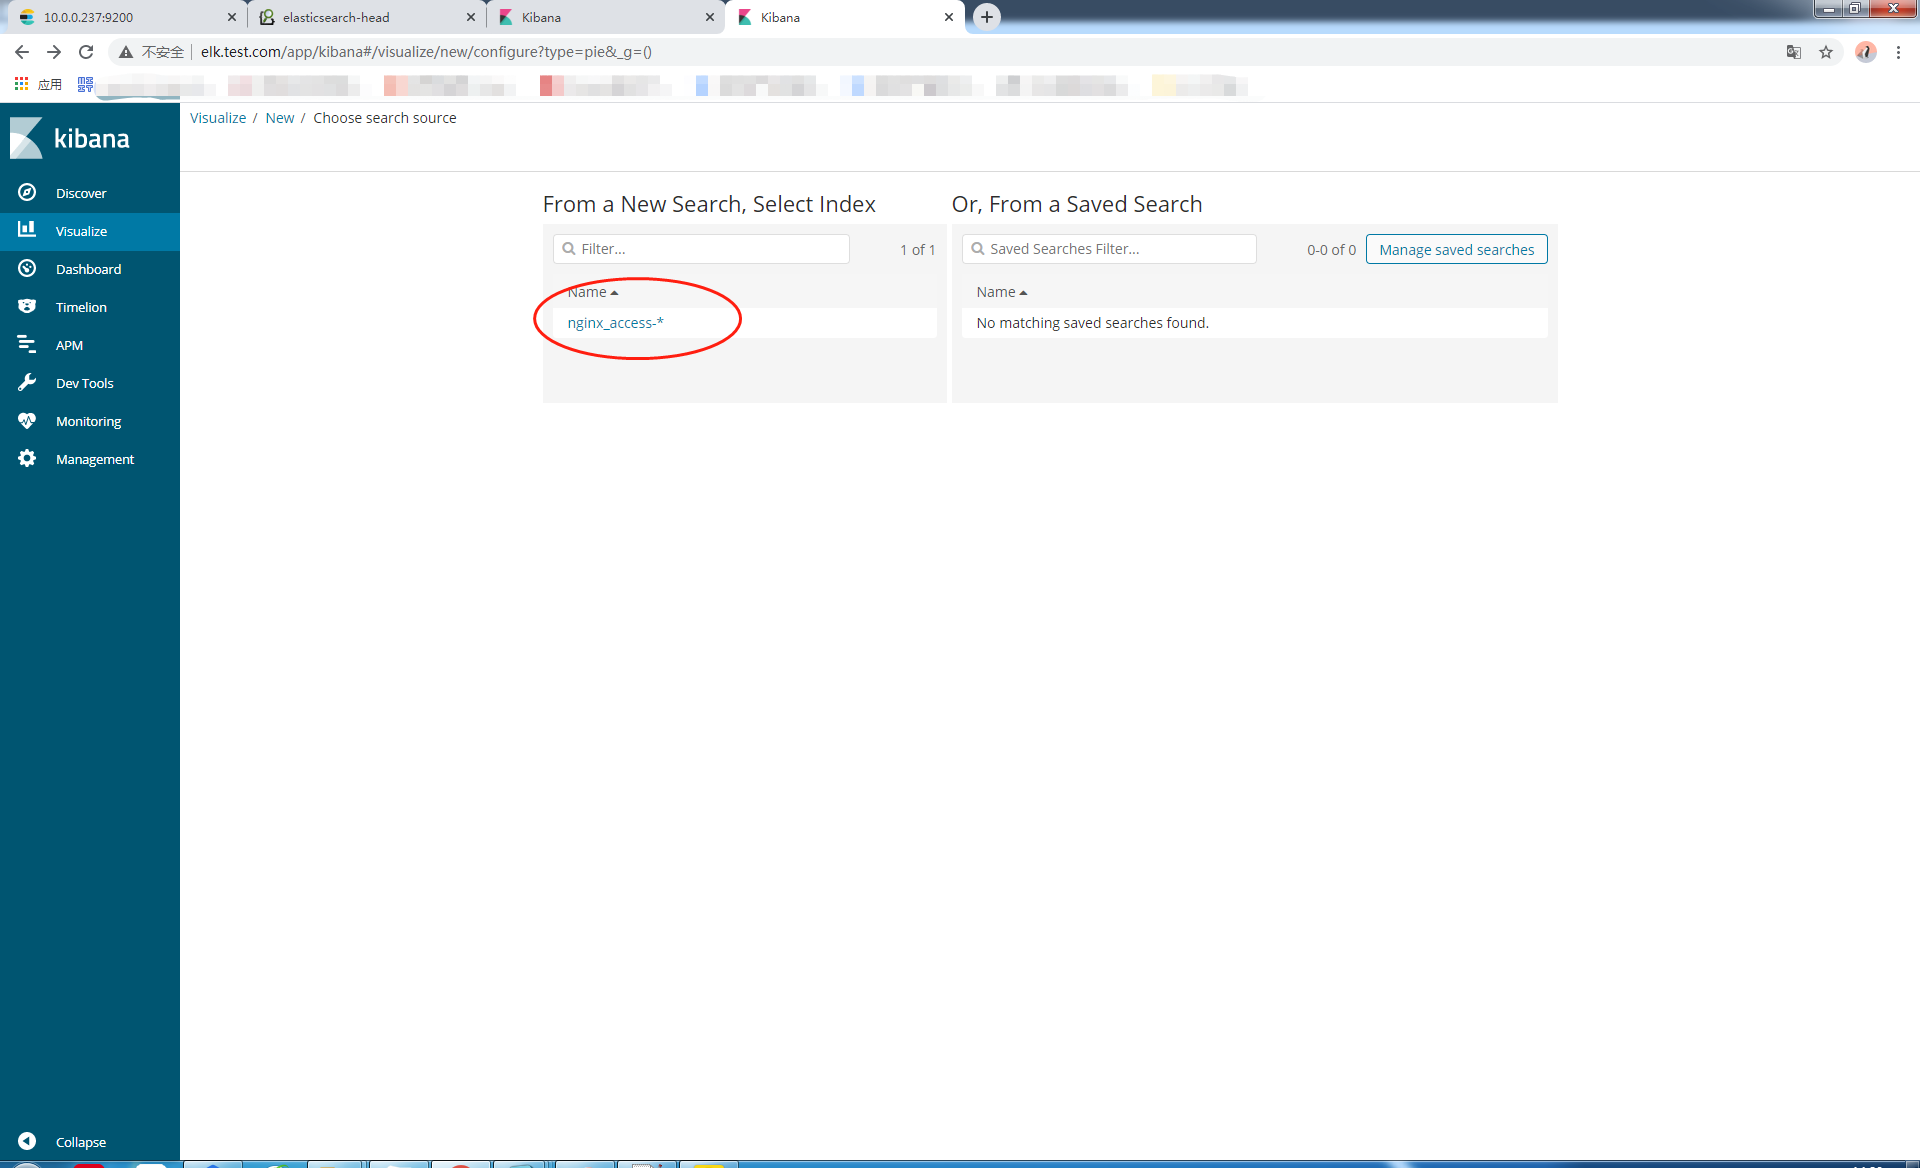
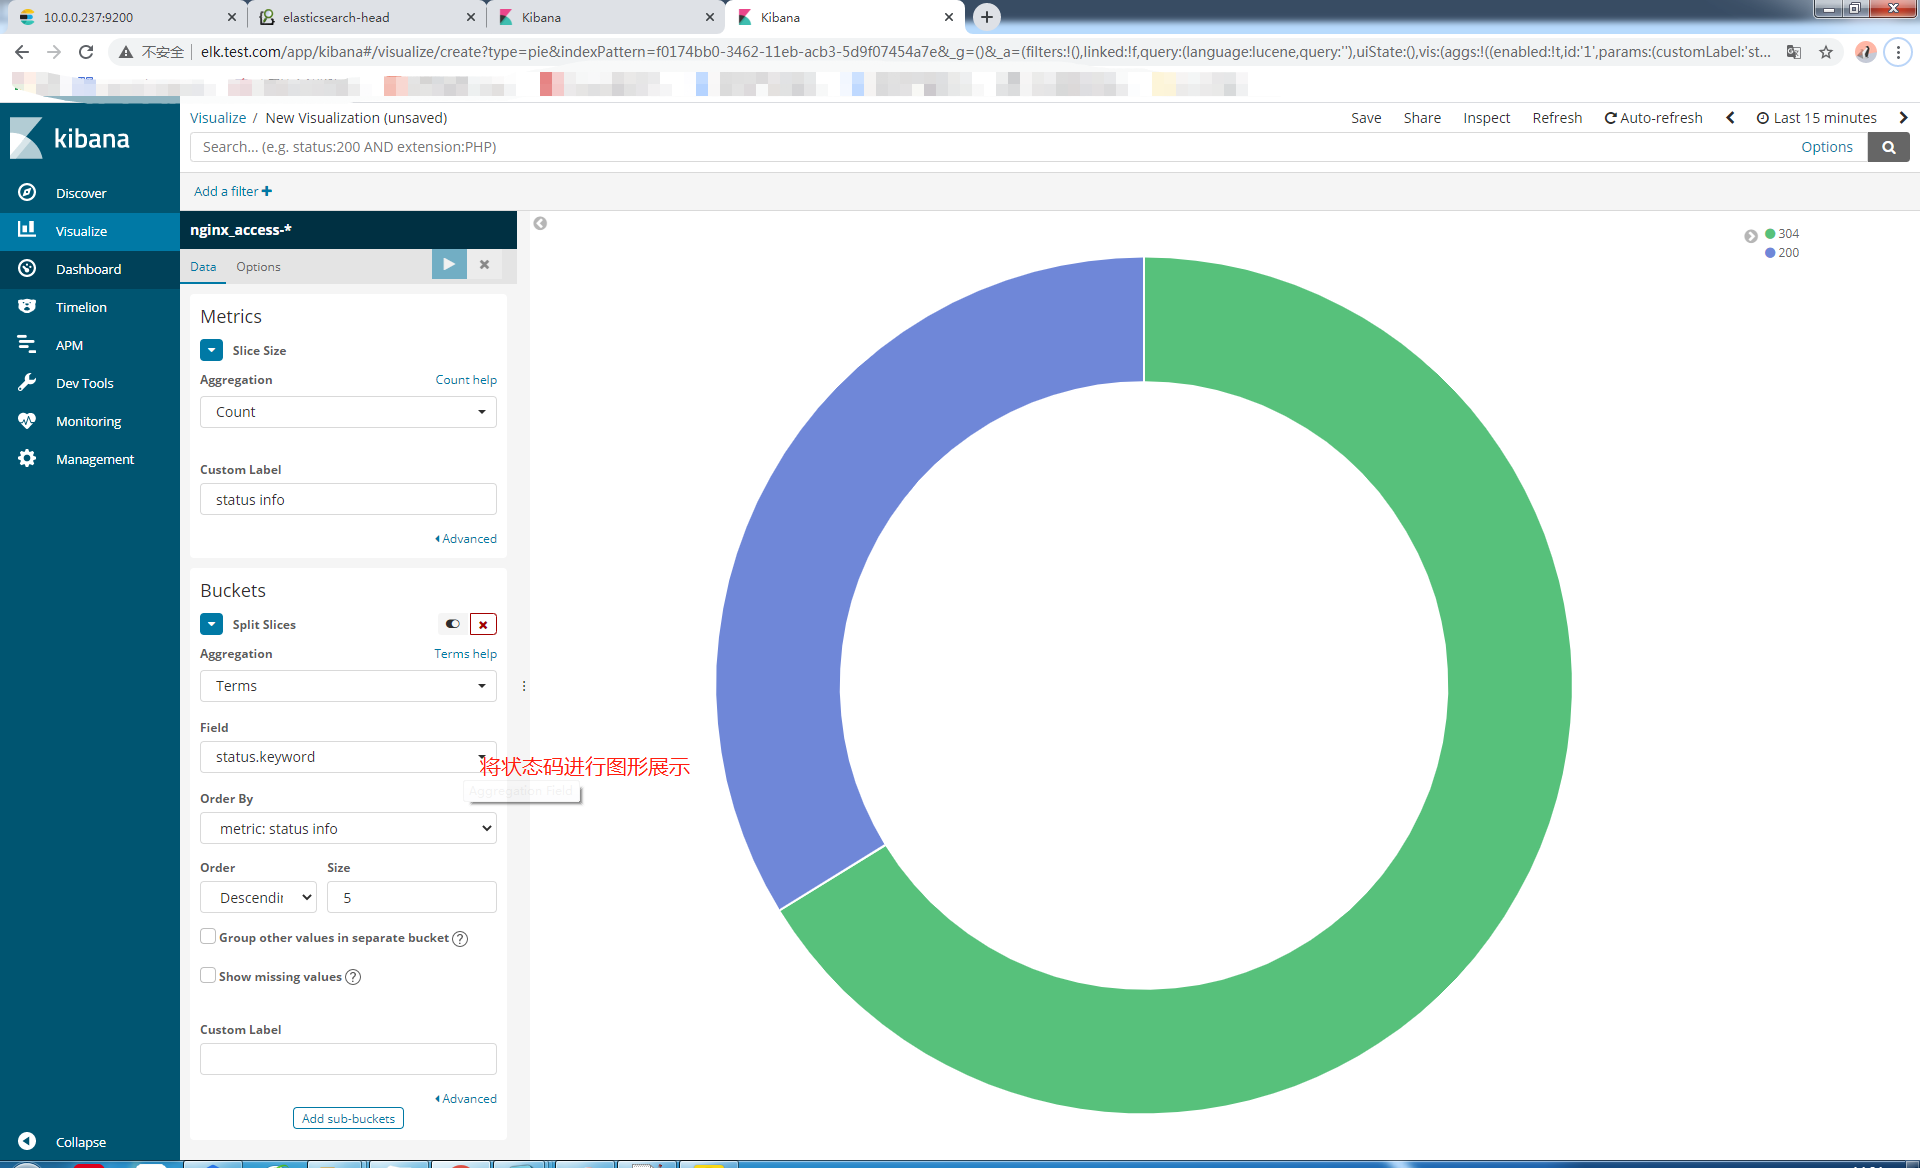
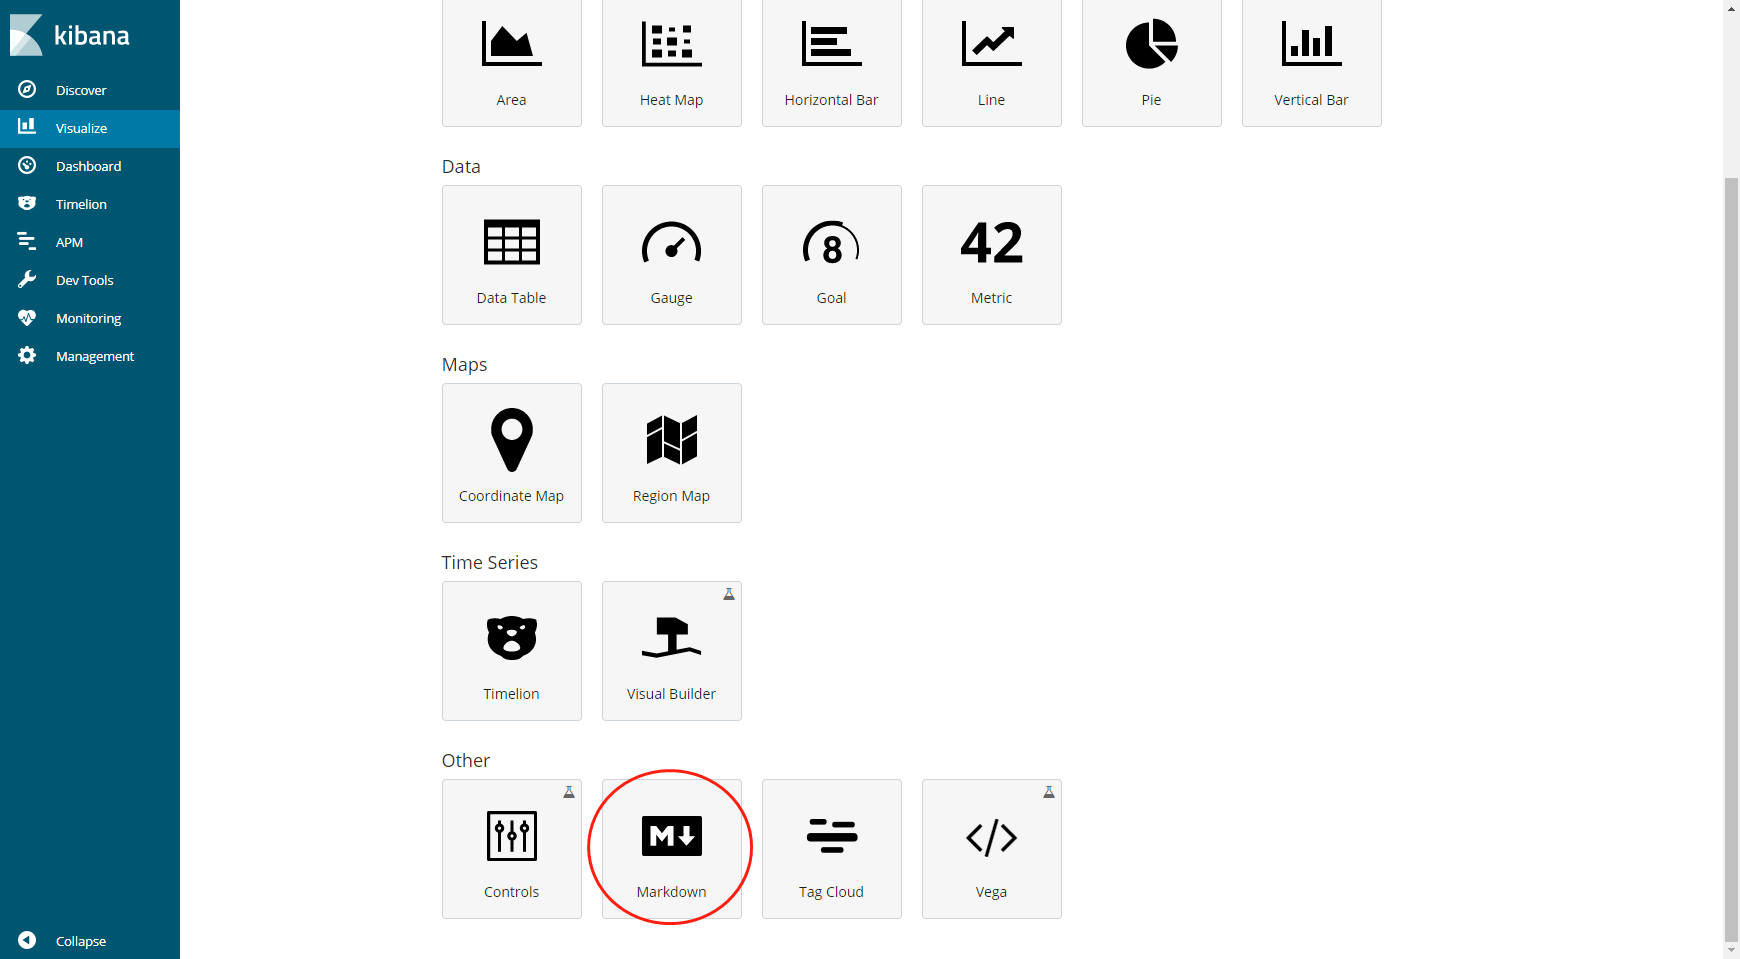
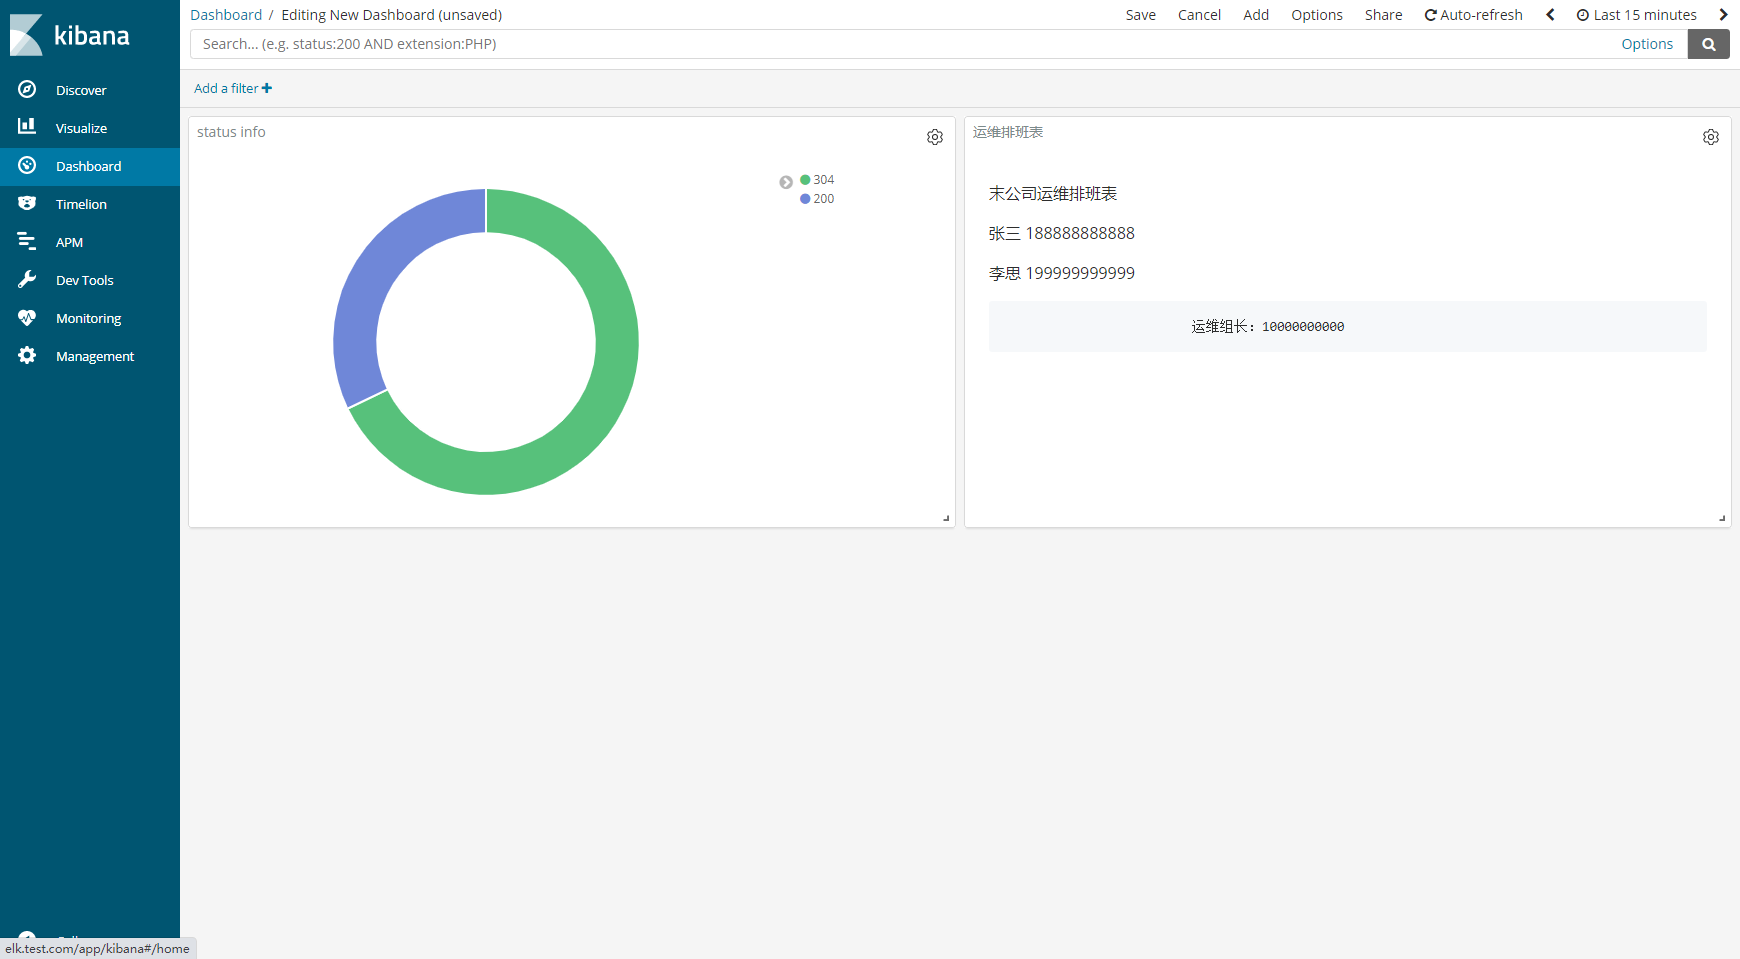
9.2.3添加一个饼状图
9.2.4创建排班表
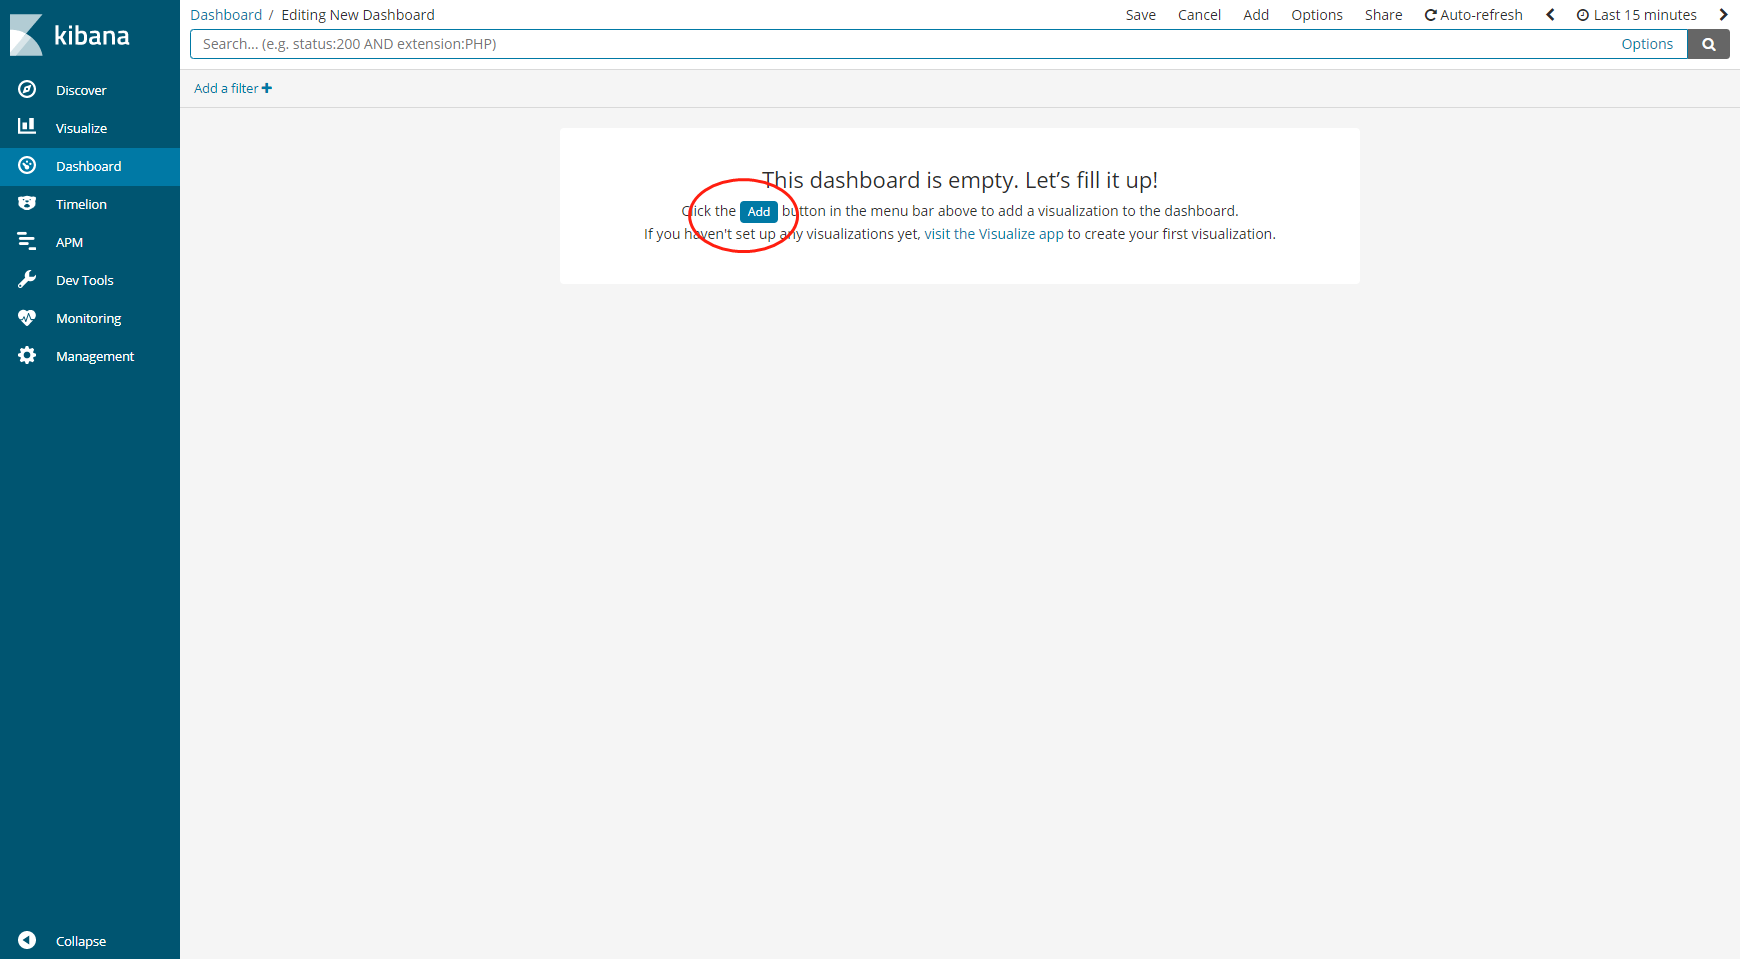
9.2.5通过dashboard进行详细展示
9.通过rdis安装部署新的架构

9.1停掉web01上的logstash服务
[root@web01-10.0.0.239 ~]# systemctl stop logstash.service
9.2在web01上安装filebeat
[root@web01-10.0.0.239 /elk_soft]# yum localinstall filebeat-6.4.1-x86_64.rpm -y
9.3修改filebeat配置文件
 24   enabled: true
 27   paths:
 28     - /var/log/nginx/access_json.log
##配置文件最后添加
  output.redis:
   hosts: ["10.0.0.237"]    #数据要发给的主机
   port: 6379               #Redis的端口
   key: "nginx-log"         #日志类型
   db: 0                    #两端要一样
   timeout: 5               #超时时间5秒
9.4启动filebeat服务
[root@web01-10.0.0.239 ~]# systemctl start filebeat.service
[root@web01-10.0.0.239 ~]# systemctl enable filebeat.service
9.5在es01上安装Redis
[root@es01-10.0.0.237 ~]# yum install redis -y
9.6修改Redis配置文件
[root@es01-10.0.0.237 ~]# vim /etc/redis.conf
  61 bind 10.0.0.237       #redis本机ip地址
  port 6379                #redis默认端口
  128 daemonize yes        #开启守护进程
9.7启动Redis
[root@es01-10.0.0.237 ~]# systemctl start redis
[root@es01-10.0.0.237 ~]# systemctl enable redis
[root@es01-10.0.0.237 ~]# redis-cli -h 10.0.0.237
10.0.0.237:6379>
9.8检查Redis是否取到日志
10.0.0.237:6379> keys *
1) "nginx-log"
10.0.0.237:6379> info keyspace
# Keyspace
db0:keys=1,expires=0,avg_ttl=0
9.8在es01上安装logstash
[root@es01-10.0.0.237 /elk_soft]# yum localinstall logstash-6.4.1.rpm -y
10修改logstash的配置文件
http.host: "10.0.0.237"      #http的IP地址
http.port: 9600              #监听端口
11在/etc/logstash/conf.d/下新增redis_input.conf文件
[root@es01-10.0.0.237 /etc/logstash/conf.d]# vim redis_input.conf
input {

  redis {
        host => "10.0.0.237"
        port => "6379"
        db => "0"
        data_type => "list"
        key => "nginx-log"
   }


}
output {
    stdout { codec => rubydebug }
    elasticsearch {
        hosts => ["10.0.0.237:9200"]
        index => "nginx-redis-%{+YYYY.MM.dd}"
  }
}
12启动logstash
[root@es01-10.0.0.237 /etc/logstash/conf.d]# /usr/share/logstash/bin/system-install /etc/logstash/startup.options systemd
[root@es01-10.0.0.237 /etc/logstash/conf.d]# systemctl start logstash
[root@es01-10.0.0.237 /etc/logstash/conf.d]# systemctl enable logstash
13kibana展示
转自:https://www.cnblogs.com/zhangfushuai/p/14975307.html